Dr. Cooper's Comments: Great!
Kyung Hyeon Lee (red)
Temperature composition diagrams
The vapor is collected and condensed in a simple distillation. This technique is used to separate a volatile liquid from a non-volatile solute or solid. In a fractional distillation, the boiling and condensation cycle is repeated to get a pure substance. This technique is used to separate volatile liquids (Figure 1).The vapor is collected and condensed in a simple distillation. This technique is used to separate a volatile liquid from a non-volatile solute or solid. In a fractional distillation, the boiling and condensation cycle is repeated to get a pure substance. This technique is used to separate volatile liquids (Figure 1).

Figure 1: Temperature-composition diagrams
The original composition of liquid (a1) is heated up to its boiling point, T2. At the point, a2, the first vapor starts forming then it ends up with the composition of vapor, a2’. It condenses with the same mole fraction of A, then the composition of liquid (a3) is collected. The successive boilings and condensations result in purer component of liquid composition. The temperature-composition diagrams show the number of steps in a distillation in Figure 2.

Figure 2: Two different shapes of temperature-composition diagrams
As shown above, in case of the narrow diagram, a substance cannot be purified quickly, so more steps are required to get purer substance in liquid composition. Therefore, it needs more time to get the certain level of liquid composition.
Azeotropes
Azeotrope is a particular mixture (two or more miscible liquids) which does not change the composition during the distillation. This mixture has two different types: a high-boiling azeotrope and a low-boiling azeotrope. In a high-boiling azeotrope (Figure 3), if a maximum occurs in the phase diagram, the liquid is stabilized due to favorable interactions between A and B molecules.

Figure 3: Azeotropes at high-boiling
In Figure 3, the vapor and the liquid compositions are the same at the highest boiling point of a mixture (the point b). When it condenses in a liquid composition, it changes as bàa4àa3àa2. During this change, the composition does not change; it stays at the liquid composition. At the point of a2, the first vapor is produced, and along the line between a2 and a2’, the liquid composition is changed to the vapor composition (a2’) which has higher mole fraction than the liquid composition (a2). However, the shape of a low-boiling azeotrope differs from the shape of a high-boiling azotrope. A low-boiling azeotrope is shown in Figure 4.

Figure 4: Azeotropes at low-boiling
If a maximum occurs in the phase diagram, the liquid is destabilized due to unfavorable interactions between A and B molecule. The point b is a low-boiling point where the vapor composition and liquid composition are the same.
Liquid-liquid phase diagrams
Now, let’s talk about temperature-composition diagrams for partially miscible liquids. Partially miscible liquids are liquids that do not mix at all proportions at all temperatures. That is, the liquid has 2 phases at some temperature ranges. When 2 liquids are mixed and miscible each other, then the mixture has only 1 phase. But if it is not miscible, it has 2 phases in liquid-liquid phase diagrams. For instance, when a small amount of liquid B is added into liquid A and dissolves completely, this binary mixture is only 1 phase. As more liquid B is added, no more B is dissolved in liquid A. Liquid A becomes saturated in B, so this binary mixture becomes 2 phases. In this phase separation, A is most abundant phase which is saturated with B. B is minor phase which is saturated with A. The phase separation in liquid-liquid mixture is shown in Figure 5.
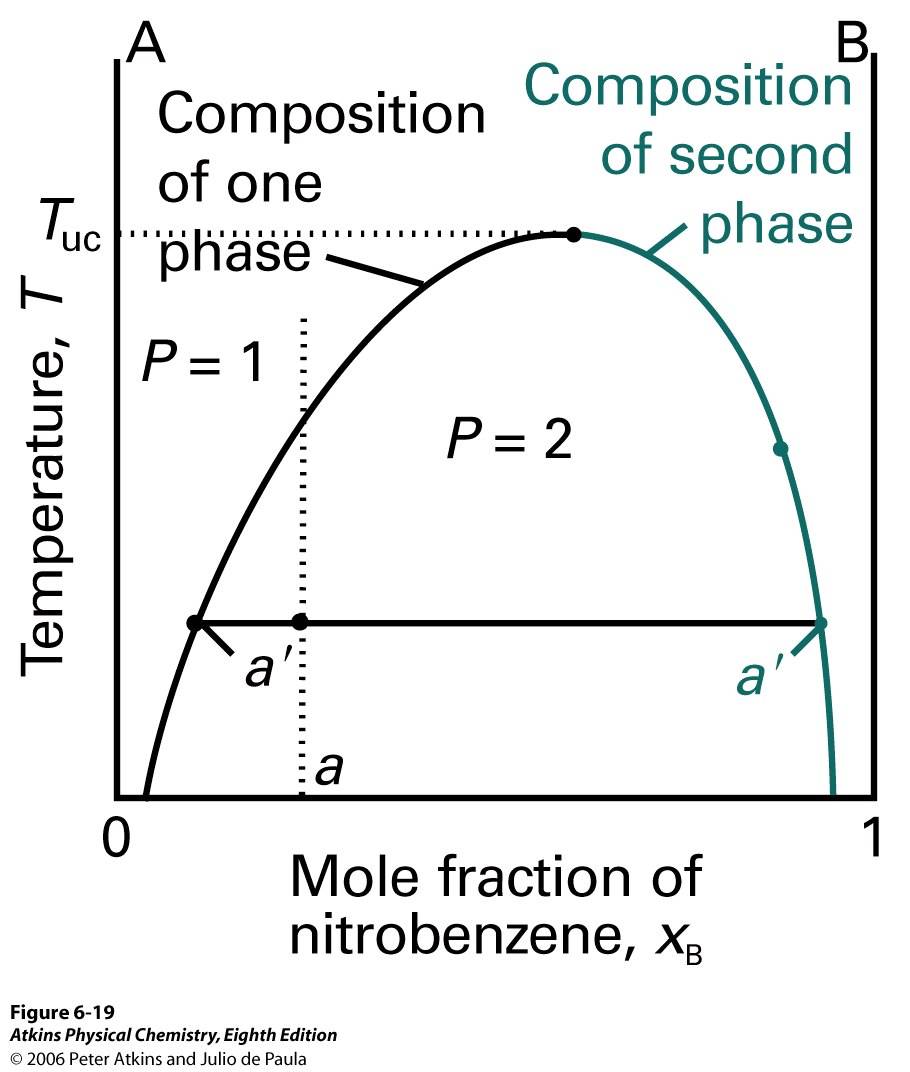
Figure 5: Temperature-composition diagram of liquid-liquid mixture having the upper critical solution temperature
In this phase diagram, the mole fractions of each A and B are the same in the line, a’; however, the only change is a relative amount of 2 phases. The relative abundance of each phase is given by the lever rule.
Critical solution temperatures
When a phase separation occurs, the highest point in a diagram is a critical point (Figure 5). This is called the upper critical solution temperature, TUC, where the subscript uc means upper critical. TUC is only shown in a higher critical solution. Above this point, this binary mixture is totally miscible. On the molecular level, this can be interpreted as the molecules come close together and the kinetic energy of each molecule overcomes molecular interactions. Some systems show a lower critical solution temperature, TLC, where the subscript LC means lower critical (Figure 6).

Figure 6: Temperature-composition diagram of liquid-liquid mixture having the lower critical solution temperature
Below this temperature, the binary mixture is 1 phase and totally miscible. The example of a lower critical solution is water and triethylamine mixture. This mixture forms a weak molecular complex, so it breaks intermolecular bonds and stays as 2 phases and less miscible. Some system have upper and lower critical solution temperature; therefore, the higher critical solution and lower critical solution diagrams can be combined as one diagram (Figure 7).
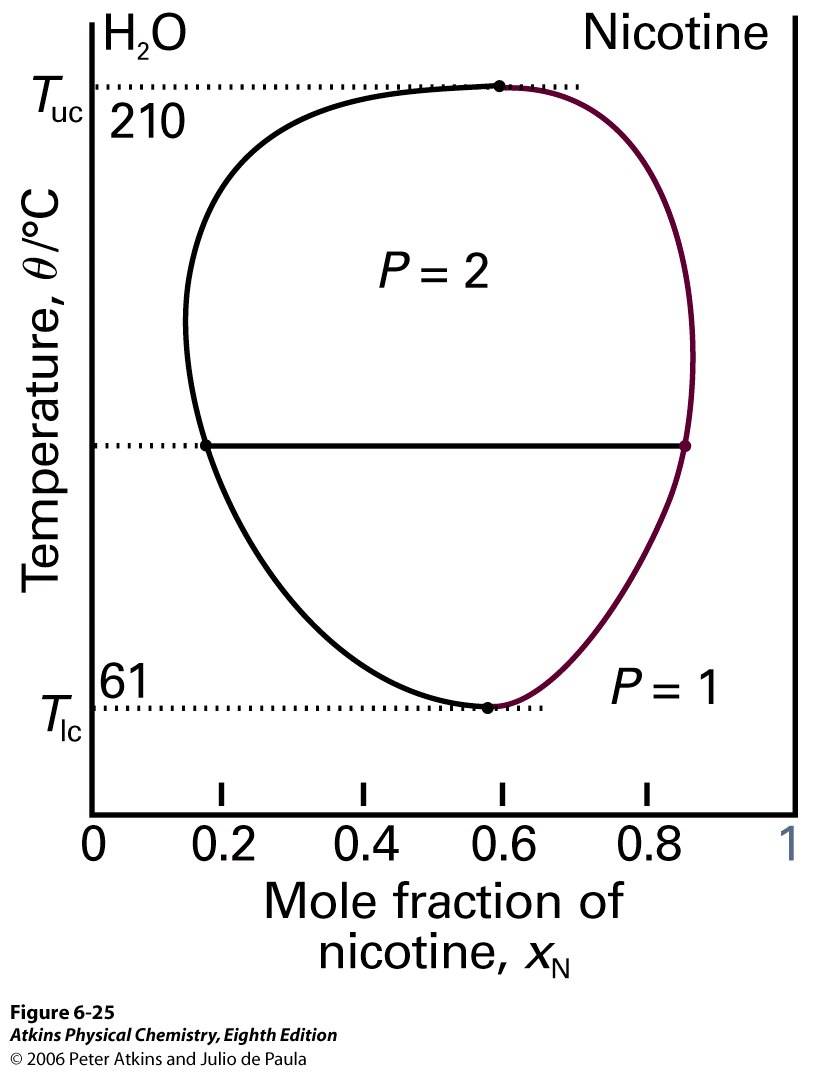
Figure 7: Termperature-composition diagram of liquid-liquid mixture having both upper and lower critical solution temperatures
Inside of the circle, there are 2 phases: the water saturated in nicotine and the nicotine saturated in water. However, outside of the circle, the only one phase exists in a mixture because it is miscible. Assume that a relative amount of water is a lot more than nicotine. Nicotine is dissolved in water and this mixture exists as 1 phase. Assume that a relative amount of nicotine is a lot more than water. This mixture also exists as 1 phase because water is dissolved in nicotine. If temperature is lower than 61℃ or higher than 210℃, the mixture exists as 1 phase and it is totally miscible.
Hyunjoo Lee - Written by BLUE
Distillation of Partially Miscible Liquids
When partially miscible liquids are distilled, pair of liquids that are partially miscible often form a low boiling azeotype.
The two common possibilities are two liquid phases mix before boiling or phase-separated liquids boil before mixing.

Figure 8 Phase diagram of a system in which the liquids become fully miscible before boiling.
From Figure 8, distillation of a mixture at point a1 is one phase of mixture heated to a point a2, reaching to a vapor. Leads to b1, which condenses to completely miscible solution at b2 (one phase), cooled down to b3 (two phase). Phase separation only occurs at point b3 when the distillate is cooled to a point in the two phase region. This only applies to the first drop of distillate. If distillation continues, the composition of liquid changes and when whole sample has evaporated, the composition is back to a1.
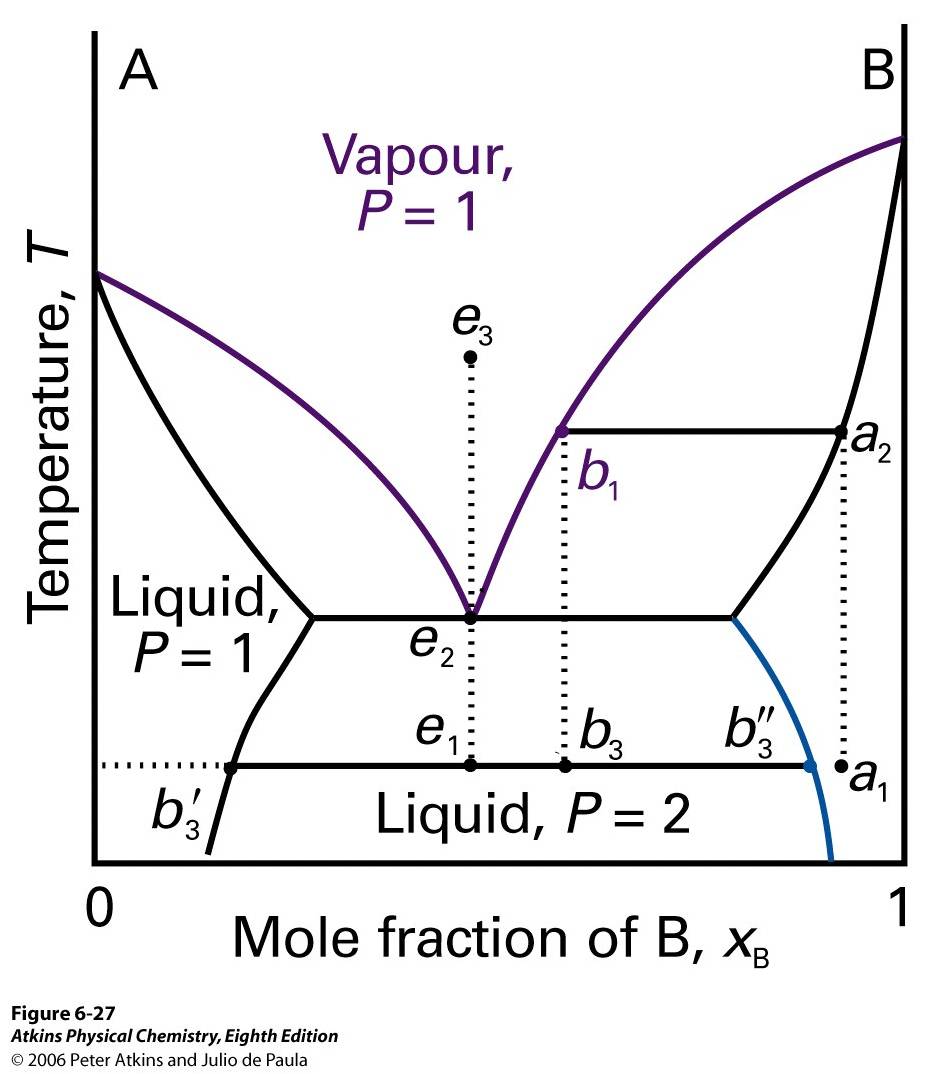
Figure 9 Phase diagram of a system in which liquids boil before mixing.
There is no upper critical solution temperature. Starting at point a1 from Figure 9, it is distilled to point a2. The vapor will exist at point b1, and the distillate obtained from a liquid a1 has composition of b3, two-phase mixture. One phase has composition b'3 and the other has composition b''3. The substance will not be miscible anywhere between rectangles on the botton of the Figure 9. e is represented as isopleth. The lowest temperature where vapor can exist is e2. As it cools, the composition would not change. At e1, a system forms two phases. This system persists up to the boiling point e2, and vapor of this mixture has same composition as the liquid. A vapor of composition e3 also gives a two-phased liquid. The mixture vaporizes and condenses as if it is a single substance at fixed temperature.
Liquid-Solid Phase Diagram
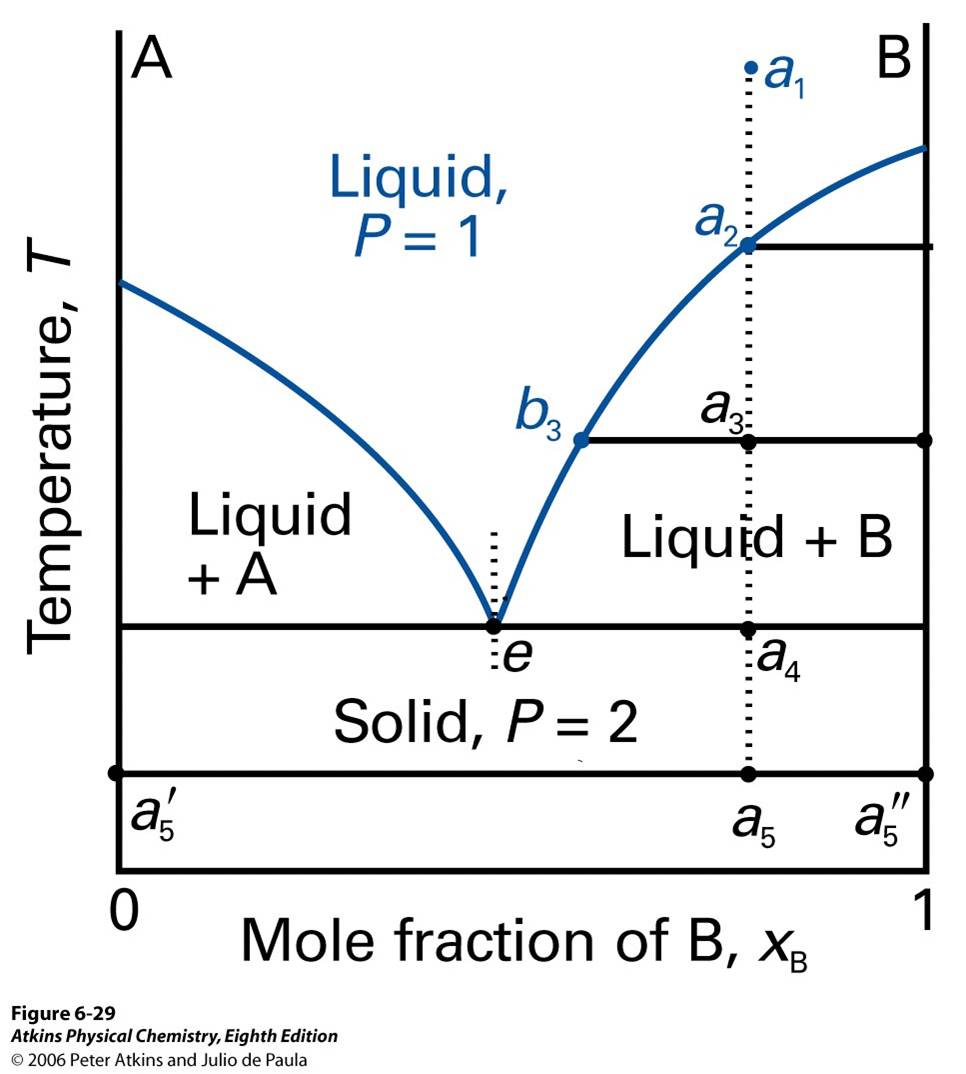
Figure 10 Phase diagram of solids and liquids
There are A and B mixed togetger. Starting at a1, it cools to a2 and first solid starts to precipitate. As we start to precipitate pure solid B, less B present in the mixture, and the remaining liquid becomes purer. At a2, more solid forms, and there are about equal amounts of solid and liquid. Since some of B has been deposited, liquid phase is richer in A. At a4, it starts to precipitate out all remaining liquids. Last liquid will have composition e, the eutectic. At some temperature a5, the composition is solid and pure A to a5', and pure B to a5''. The liquid now freezes to give two-phase system of pure A and pure B.
Eutectics
The isopleth e refers to eutectic, where the mixture has a single and the lowest melting point. All constituents crystallize simultaneously at this temperature from liquid solution for the mixture at such proportions that has lowest melting point. The one place where you can get phase change, without changing composition, both substances go through the phase change at the same time. At eutectic composition, neither A or B precipitate, but they both precipitate at the same time. Solutions with compositions to the right of e, deposit B as they cool. Solutions with compositions to the left of e, deposit A as they cool. A liquid with eutectic composition freezes at single temperature while solid with eutectic composition melts without changing composition at lowest temperature.
Example 1)
Solder: eutectic composition of Tin and Lead. Designed to stay the same composition when melted, and make it melt at lower temperature.
67% Sn + 33% Pb melts at 183°C
Melting point of Sn = 232°C
Melting point of Pb = 327.5°C
Example 2)
23% NaCl + 77% H2O melts at -21.1°C. The mixture will melt above this temperature.
Melting point of NaCl = 801°C
Melting point of H2O = 0°C

Figure 11 Liquid-Solid phase diagram with eutectic freezing point
The substance is on line a, which cooled down. Starting at a1, rapidly cooled down to a2, when first amount of B starts to precipitate. Then cooling slows down and reach a3. As B precipitates, it goes slower rate to go through final phase change, a4. At a4 from Figure 11, it solidifies under the process of eutectic freezing.
Reacting Systems
Many binary systems react to produce different compounds. One important example is the formation of GaAs, gallium arsenide, which is very important for the manufacturing of semiconductors.
Ga + As = GaAs
The above equation is two-component system with three constituent. A(Ga) and B(As) react together to form C(GaAs). System prepared with A and excess of B consists of C, and unreacted B. There are 1:1 ratio of pure A and pure B.

Figure 12 Phase diagram for a system A+B ↔C
Left part of Figure 12, represents pure A, and right part represents pure B. A and B are mixed in 1:1 ratio to form C. The line in the middle of the figure 12, corresponds to mole fraction of half of both A and B. Starting at a1, cools to a2. As solution continues to cool, there are pure C present. As approach to a4, everything else will precipitate, left with two-phases. One phase contains C, product of the reaction. The other phase contains solid B, an excess. On left side of the graph, A is an excess. Below a4, there are always two phases, with some C and some B. except line C. Line C will always contain pure C. At compositions on the left half of the graph, the solid consists of A and C.
Comments (0)
You don't have permission to comment on this page.